How Do You Use an Infographic? article
Learn strategies for using for using the eye-catching and informative infographics. Did you know one study estimates that as much as 65% of the population learns visually? Infographics are great to distribute at tradeshows and post on your website.

Chances are, you’ve seen them around the internet: brightly colored and eye-catching charts or tables. But are they just charts? Just tables? Just information? The answer is no. So, what are infographics, and how can they help you sell?
Engaging Storytelling
Would you believe that 65% of the population is believed to learn visually? That’s more than half of everyone you’re selling to. More importantly, roughly 90% of the information that gets transmitted to the brain is visual. Wordy brochures and pamphlets might have the most information, but they don’t catch quite as many eyes. People want to see pictures.
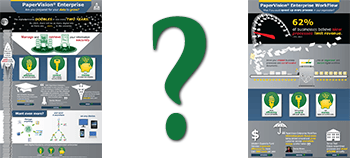
Enter the infographic. These visual aids turn all that information into attention-grabbing colors and figures. Built by a graphic designer or graphic artist, the infographic relies on a range of colors in conjunction with a handful of pictures to convey information (hence the name). Infographics have a range of uses and provide information about anything from gardening to movies to voter registration numbers to animal facts.
Turning Infographics into Sales
Did you know that Digitech Systems provides many ECM and product-specific infographics for you to use?
As time goes by, more and more people have seen the benefit of the infographic. Our infographics are aimed at the end-user, in most cases, as a way to give them a general overview of the information they’re looking for.
Infographics are especially useful in the technology world because they turn a lot of figures and abstract information into concrete, visual facts. In short, they’re a good way to easily educate the reader on some rather complex topics. Infographics can be used to:
- post to your website
- attach to a tweet or other social post
- print and distribute in sales appointments
- send in an email to follow up with a prospect
- distribute at a tradeshow
Contact your CDM if you have any questions.